❤️ Would you like to save this?
Floral prints aren’t exactly a niche fashion choice.
They’re everywhere. Dresses, blouses, skirts, spring collections—you’d be hard-pressed to browse a women’s fashion retailer for five minutes without running into flowers.
Which makes floral one of those things nobody in the industry really questions. It’s the default. It’s safe. It goes in the spring line because it goes in the spring line.
Our ThreadCurve reader data points somewhere else entirely.
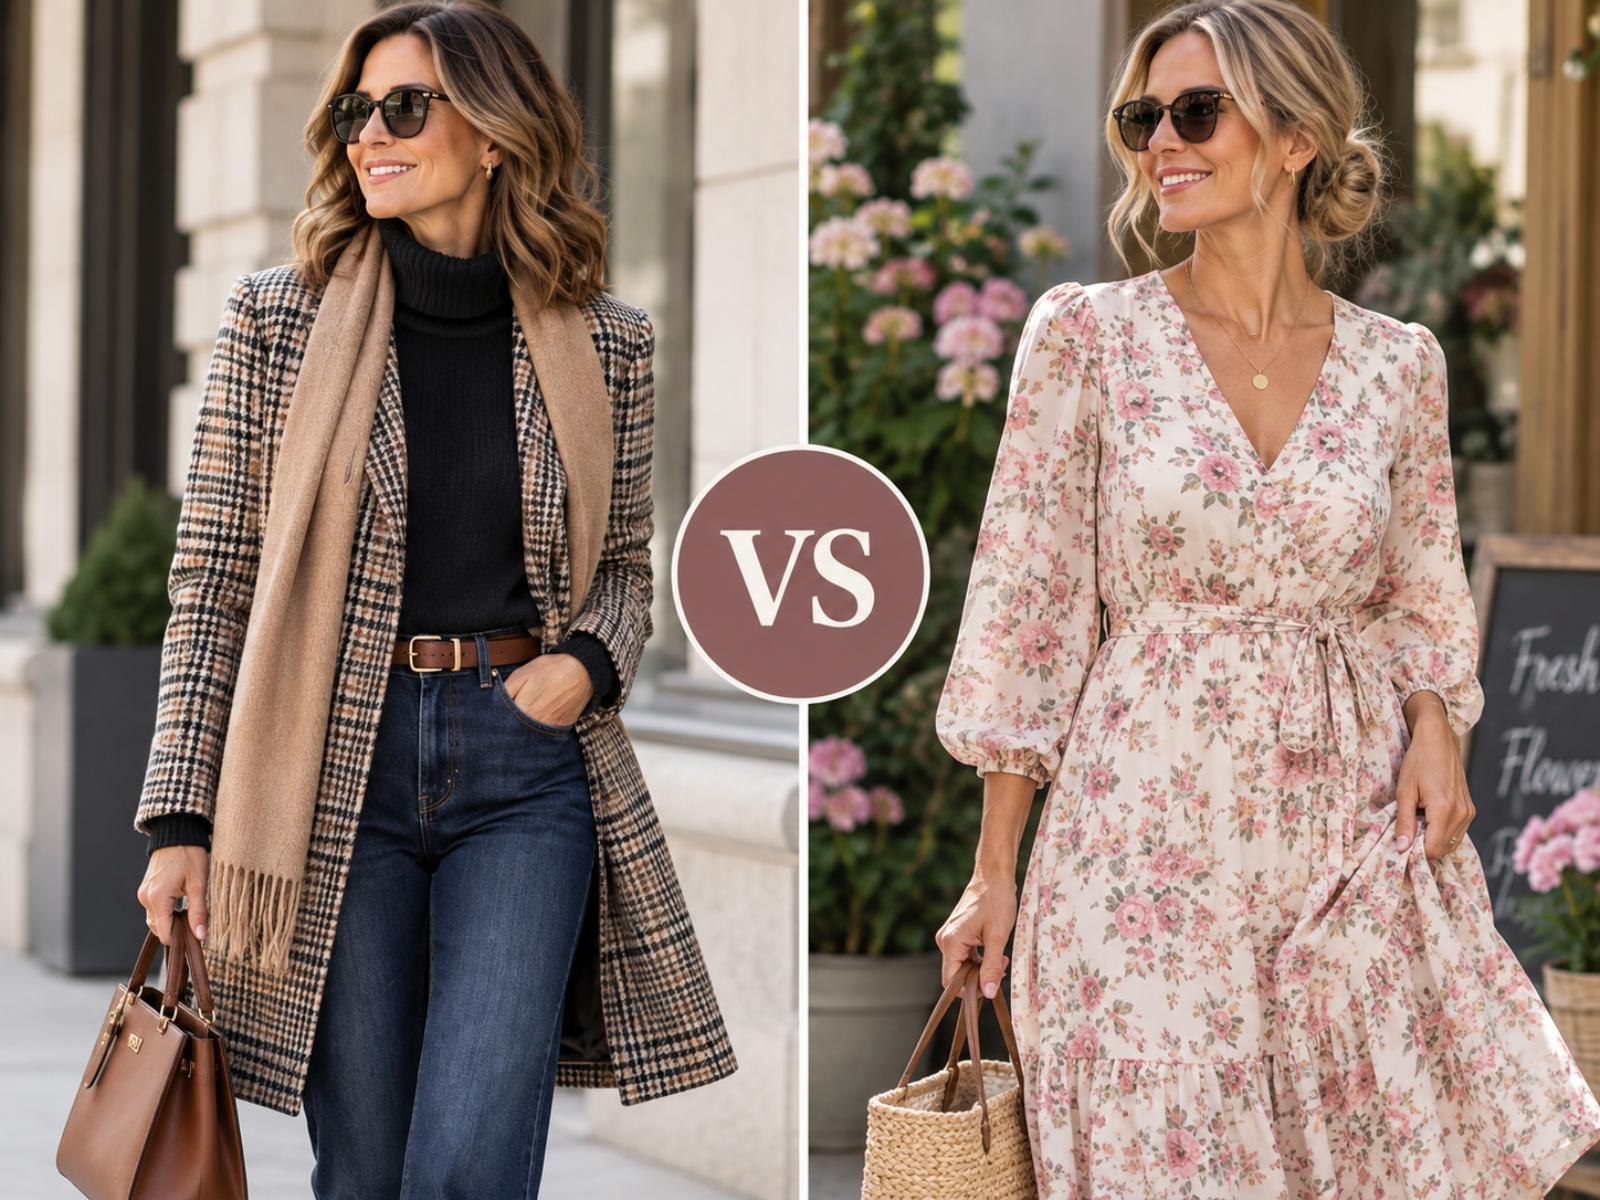
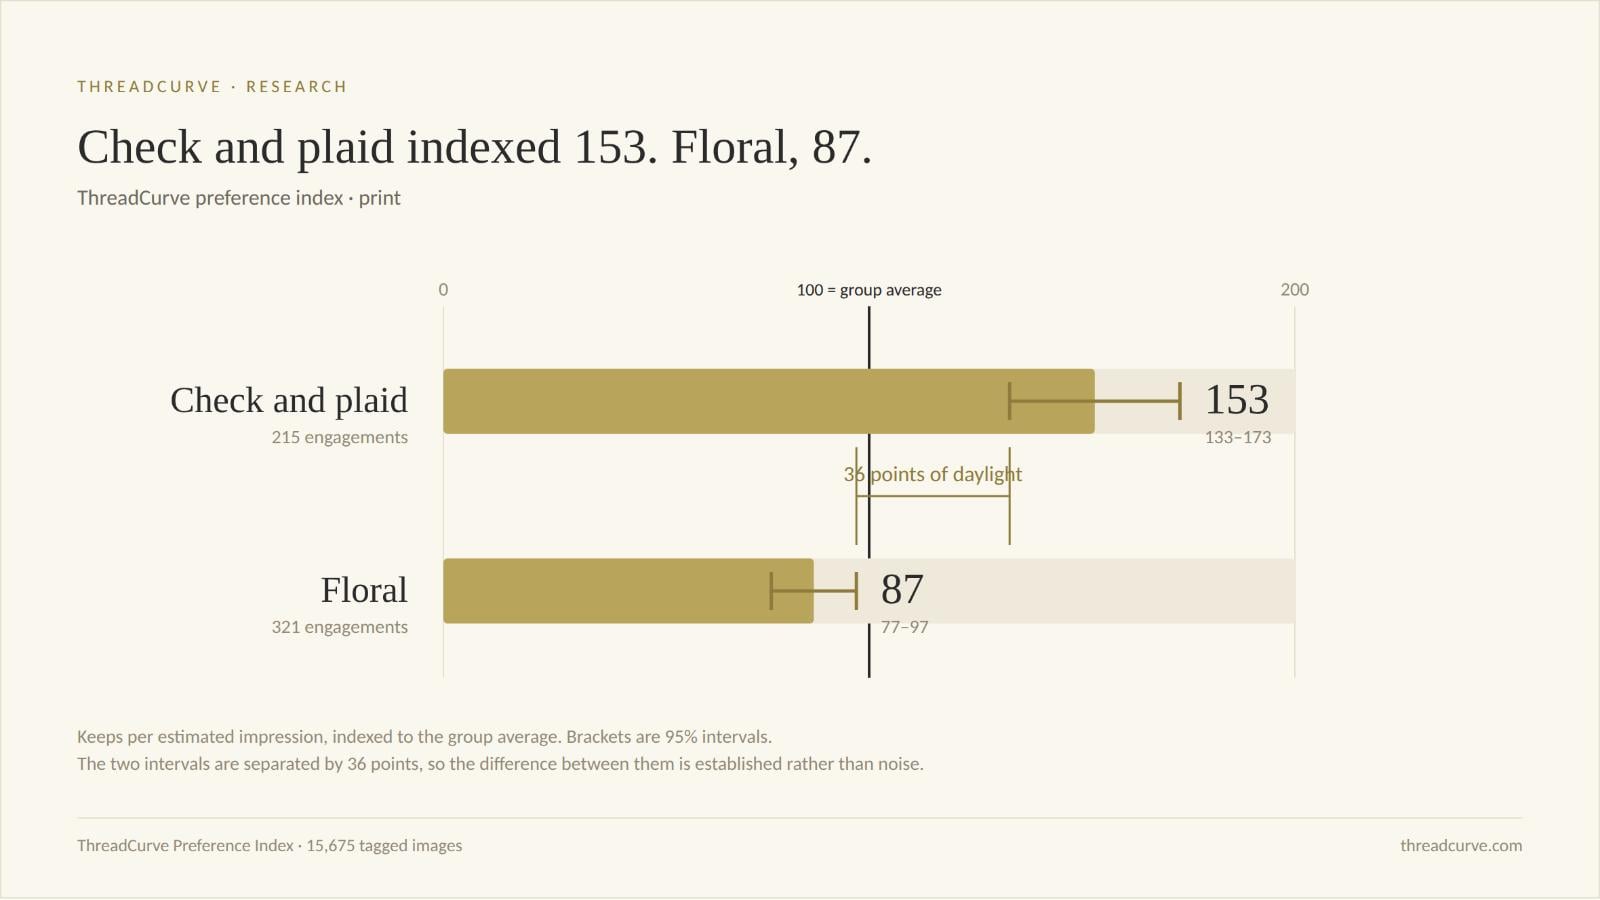
Check and plaid patterns recorded a Preference Index of 153.
Floral came in at just 87.
That’s not the kind of gap you talk yourself out of.
Check and Plaid Have a Big Lead
ThreadCurve’s Preference Index measures reader keeps—love and save actions relative to estimated image exposure—against the average for the fashion group.
An index of 100 represents average performance.
| Preference Index | 95% CI | Engagements | vs. group average | |
|---|---|---|---|---|
| Check/plaid | 153 | 133–173 | 215 | +53% |
| Floral | 87 | 77–97 | 321 | −13% |
Both groups clear the 100-engagement threshold I use for these comparisons.
And they’re moving in opposite directions.
Check and plaid run from 133 to 173. The whole range sits above 100.
Floral runs from 77 to 97. The whole range sits under it.
At their closest point the two intervals are still 36 points apart, so this isn’t a difference I have to squint at. Check and plaid outperformed floral in this data, and the gap holds at 95% confidence.
The Preference Index for check/plaid is about 1.76X floral’s.
What Data Like This Is Actually For
Here’s the part I want to be careful about, because it’s the whole reason I bother measuring any of this.
This number does not tell a retailer that plaid will sell 76% better than floral. We’re not measuring sales. Nobody in our data bought anything.
What it does is tell you which of your assumptions are worth questioning.
“Floral is the safe spring print” is an assumption. It’s held so widely that nobody checks it. And when I look at how our readers actually behave in front of a fashion image, that assumption is the one thing in this comparison that doesn’t survive contact with the evidence.
That’s a different kind of useful than a forecast.
A forecast tells you what to do. This tells you where you might be wrong—which is cheaper to act on and much harder to get anywhere else.
Floral May Have a Familiarity Problem
The data can’t tell us why readers respond this way, so this part is interpretation.
But floral has one potential problem that plaid doesn’t have to the same degree: sheer ubiquity.
Want to make a spring dress? Add flowers.
Need a feminine blouse? Flowers.
Summer skirt? More flowers.
There’s nothing inherently wrong with any of that. But something can be perfectly attractive and still become visually predictable.
Check and plaid create a different effect. They introduce structure. The lines give an outfit geometry and contrast, and depending on scale and color, plaid can read as classic, preppy, casual, tailored, outdoorsy or even a little rebellious.
It has visual presence without necessarily making the outfit difficult to wear.
That may help explain why readers are responding to it. It’s a theory, not a finding.
This Isn’t Just About Fall Flannel
Plaid has a branding problem of its own.
Mention plaid and it’s easy to picture a red flannel shirt.
But the category is considerably broader than that. A subtle windowpane blazer, checked trousers, a houndstooth-adjacent coat or a muted plaid skirt look entirely different while still benefiting from the underlying structure of the pattern.
Which makes the result more interesting for retailers. The opportunity isn’t “sell more plaid shirts.” It’s that checks and plaids may be worth testing across categories where nobody currently puts them.
The Experiment I’d Run
If I were running creative for a women’s fashion retailer, I’d test this directly.
Take two otherwise comparable looks. One floral. One check or plaid. Similar models, similar styling, similar photography.
Then watch click-through rates, saves and product-page engagement.
That’s a cheap experiment. It uses inventory you already own and photography you were going to shoot anyway. And it answers a question our data raises but can’t settle: whether the response we’re seeing survives contact with a shopping cart.
Floral Isn’t the Loser Everywhere
There’s a reason I’d be cautious about declaring the death of floral.
“Floral” is an enormous category.
Tiny ditsy florals may behave differently from oversized botanical prints. Muted florals may perform differently from bright ones. A floral midi dress may behave nothing like a floral blouse.
Season probably matters too.
So the more useful question isn’t whether plaid beats floral. It’s which plaids are driving the result—and which florals are dragging theirs down.
An 87 built from a genuinely weak majority and a strong minority is a completely different business problem from an 87 where everything performs the same. Our current data can’t separate those two, and that’s the honest limit of what I can tell you today.
The Numbers at a Glance
| Metric | Check/plaid | Floral |
|---|---|---|
| Preference Index | 153 | 87 |
| 95% confidence interval | 133–173 | 77–97 |
| Difference from average | +53% | −13% |
| Engagements | 215 | 321 |
| Relative Preference Index | 1.76X | 1.00X |
The engagement counts aren’t enormous, but they’re comfortably above my minimum threshold—and the intervals they produce don’t overlap, which is the test that actually matters.
The Takeaway
Floral remains one of the most familiar prints in women’s fashion.
But familiar doesn’t necessarily mean compelling.
Check and plaid recorded a Preference Index of 153. Floral scored 87. That’s a 1.76X difference, with 36 points of daylight between the two confidence intervals.
I’m not sure the lesson is “stop selling floral.”
It’s that one of the least examined assumptions in women’s fashion merchandising just failed a test nobody was running.
You don’t need data like this to dictate your inventory.
You need it to tell you which assumptions are worth questioning.
About the Data
ThreadCurve measures reader interactions with individual fashion images. The Preference Index compares keeps—love and save actions relative to estimated image exposure—against the average for the relevant group. An index of 100 represents average performance.
This is observational image-preference data, not sales or purchase-intent data. Impressions are sampled and scaled estimates, and results are most useful for comparisons within the dataset. Where two intervals overlap, no difference between those values is claimed.
The current ThreadCurve export contains 15,675 tagged images across 541 articles.