
ThreadCurve readers have been voting on Christmas outfits: a heart or a thumbs-down under every photo in our holiday articles, from 1950s Christmas dinners and 1980s Christmas parties to this year’s velvet, plaid and coats. We’ve pulled it all into one report: 22,507 votes from 2,612 readers on 851 outfits, the reasons readers gave, and 1,309 poll answers.
Navy beat red
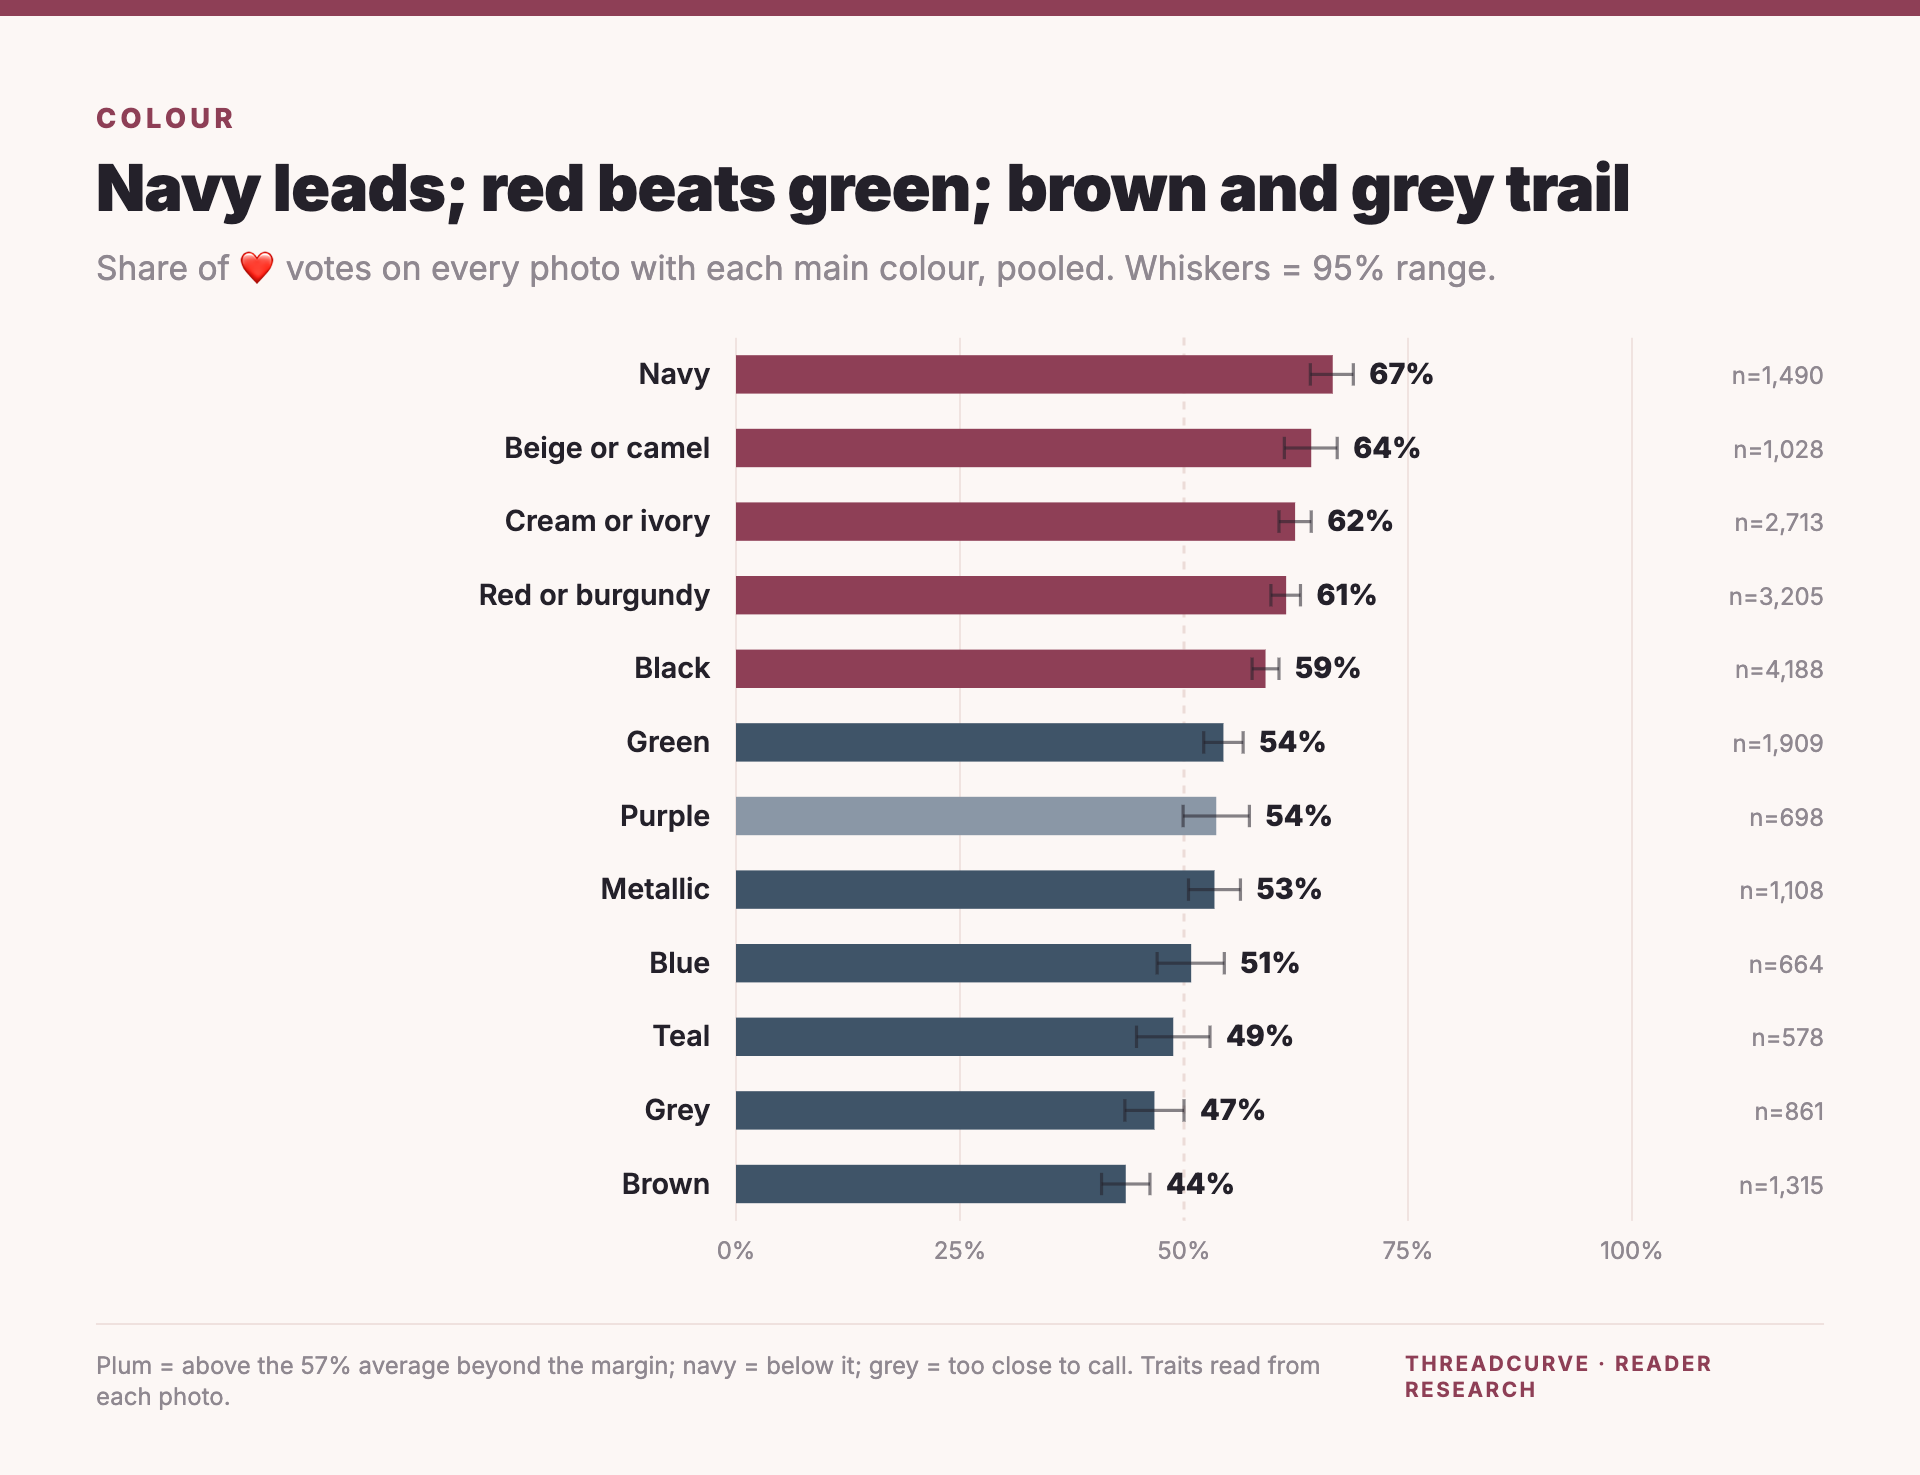
Outfits whose main colour was navy drew 67% hearts; red and burgundy drew 61%. Navy also scored above the average of the articles it appeared in. Red still beat green (54%) and metallic (53%), and brown (44%) came last.
Wool beat satin
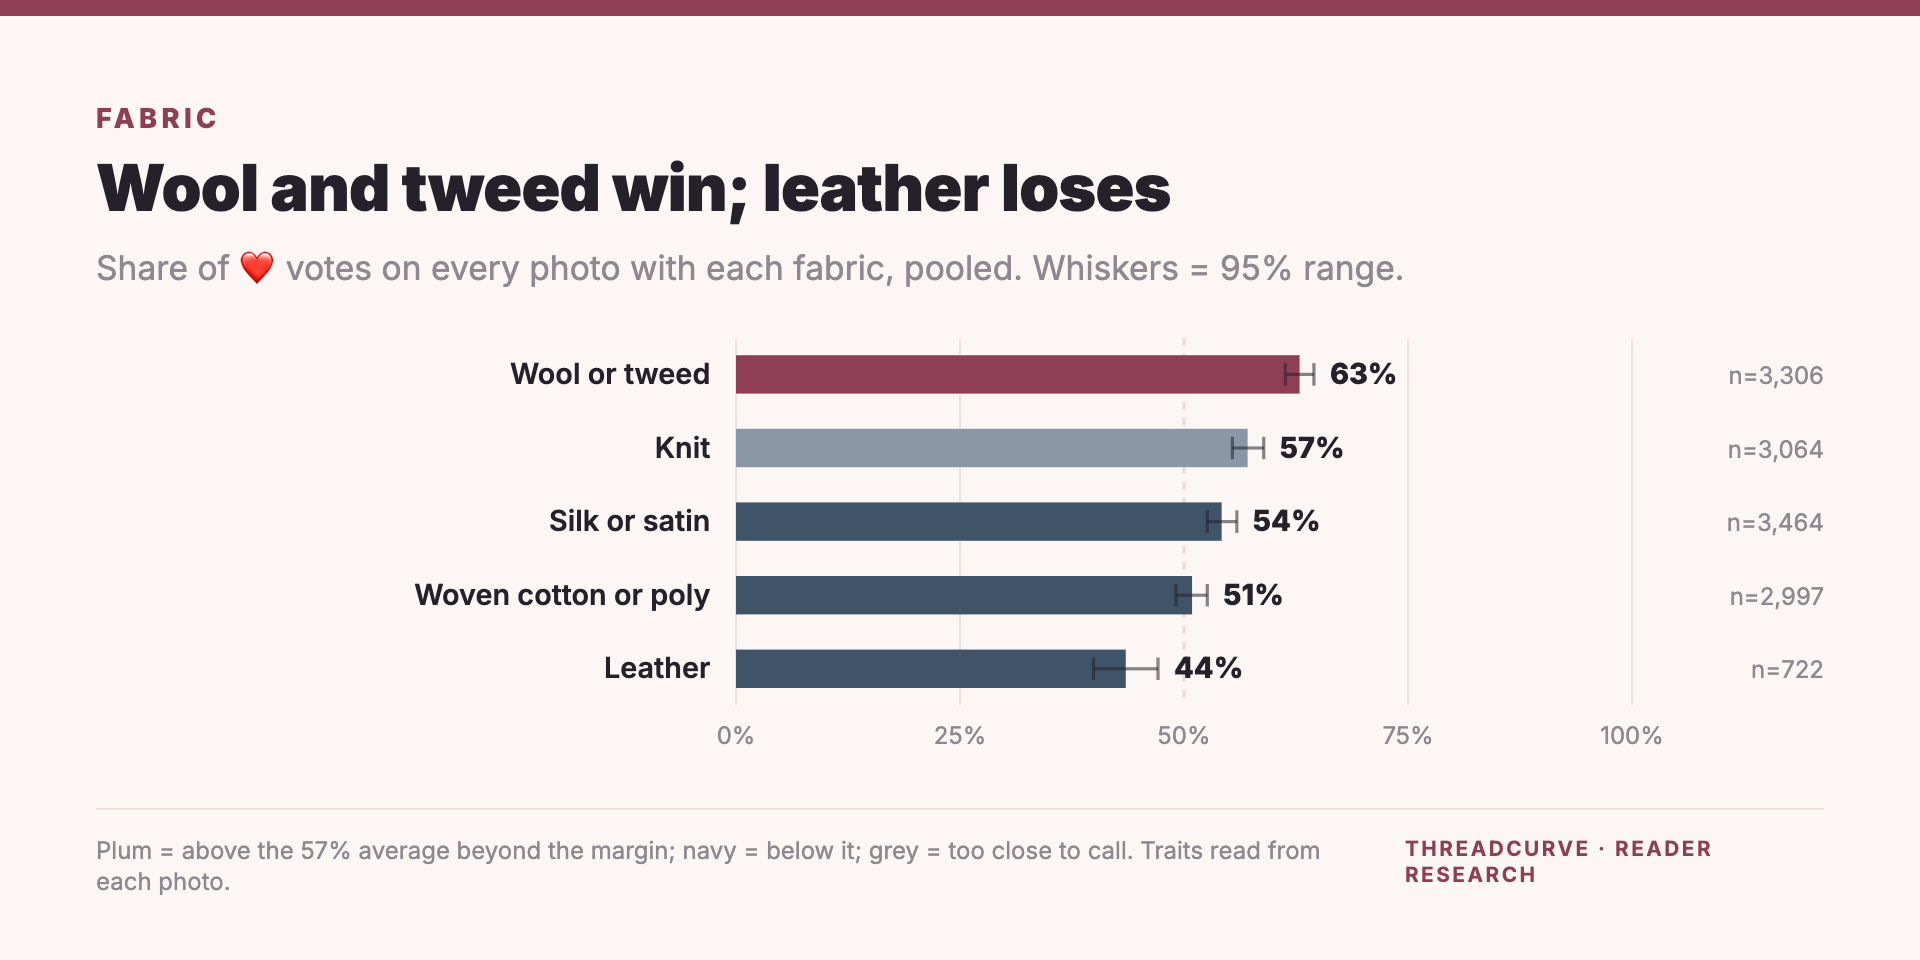
Wool and tweed drew 63%, ahead of knits (57%) and silk or satin (54%). Leather came last (44%). Shape mattered too: wrap silhouettes drew 75%, maxi hems 64% and V-necks 64%, and outfits built around a coat drew 86%.
Heels in the photos, flats in real life
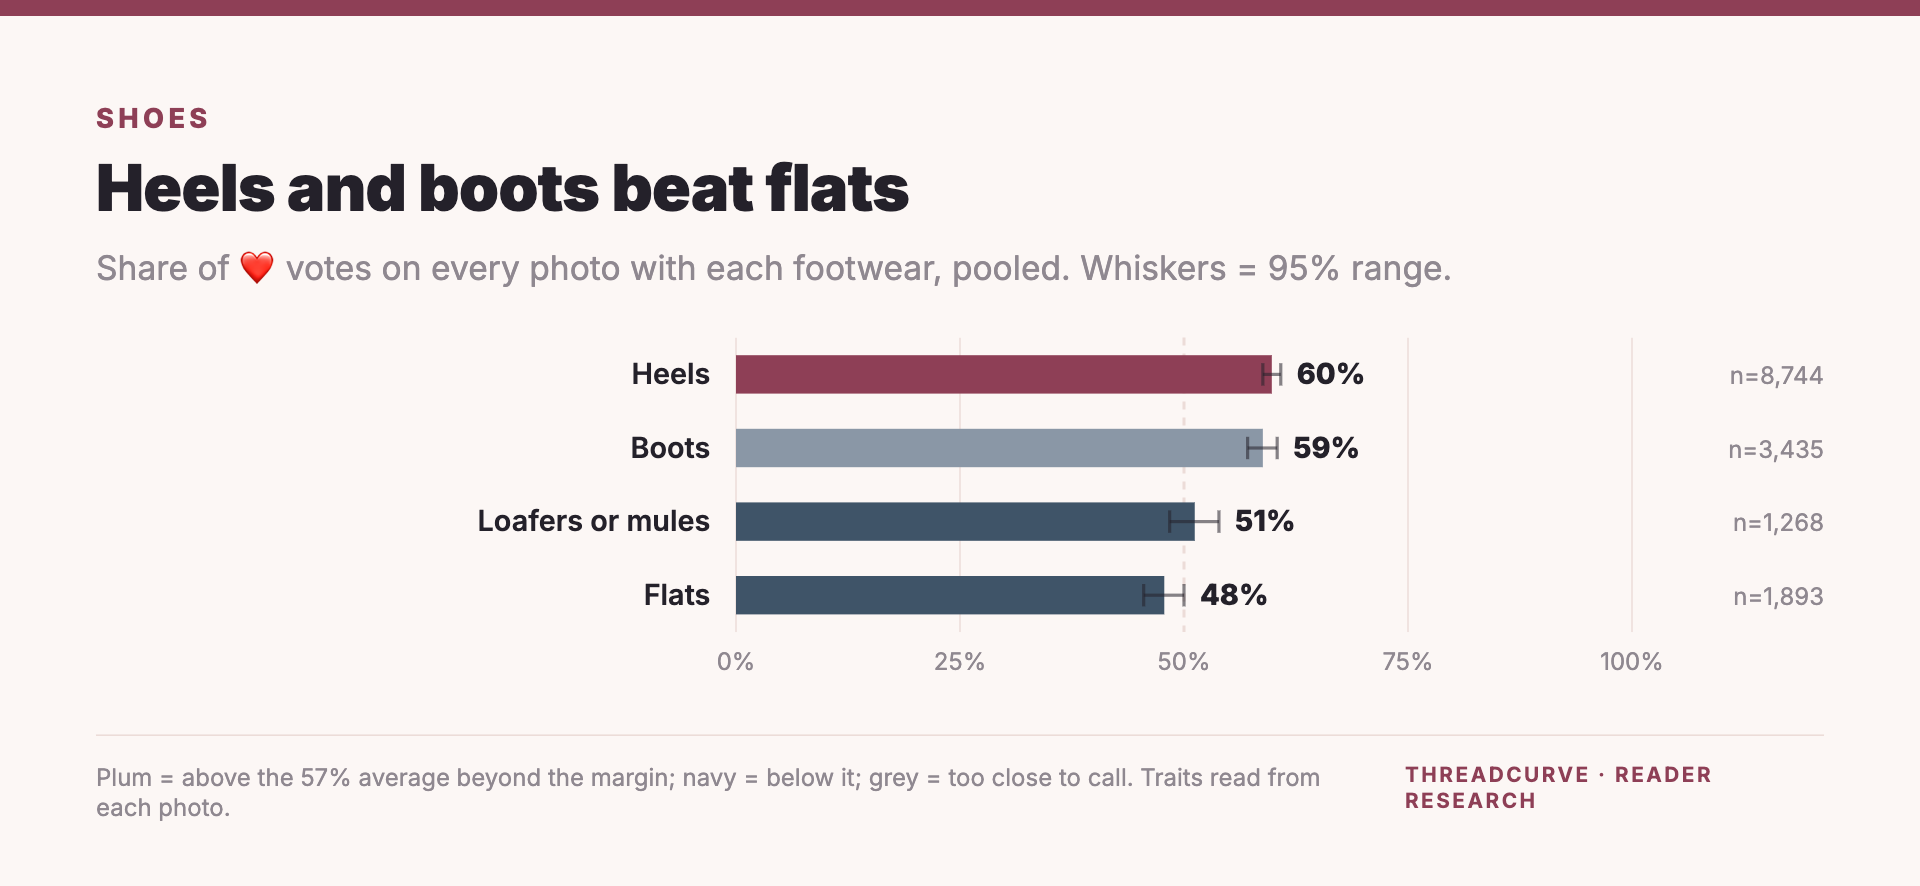
In the photos, heels (60%) and boots (59%) beat flats (48%). But when we asked readers which heel height they would choose, 45% picked flat and 42% low, and only 13% high. When readers explained a thumbs-down, “Not my style”, “Looks dated” and “Too frumpy” led.
The full report
The Holiday Outfit Report pools the outfits by colour, fabric, garment, occasion, style, shoes, hemline, pattern, silhouette and neckline, ranks the most- and least-loved looks, and adds why readers voted the way they did and 4 clothing polls. It includes the full dataset.
Get the full report at StatwrenHow we did this
- Readers tapped a heart or a thumbs-down under each photo in 20 of our Christmas outfit articles between Aug 30, 2026 and Nov 17, 2026. One vote per reader per photo.
- Votes are anonymous: no names, emails or accounts. Readers were reacting to photos, not trying the outfit on.
- Percentages are the share of hearts. Traits such as main colour and fabric were read from each photo; article groupings are ours.
- More on how we collect reader data: How our reader data works.