❤️ Would you like to save this?
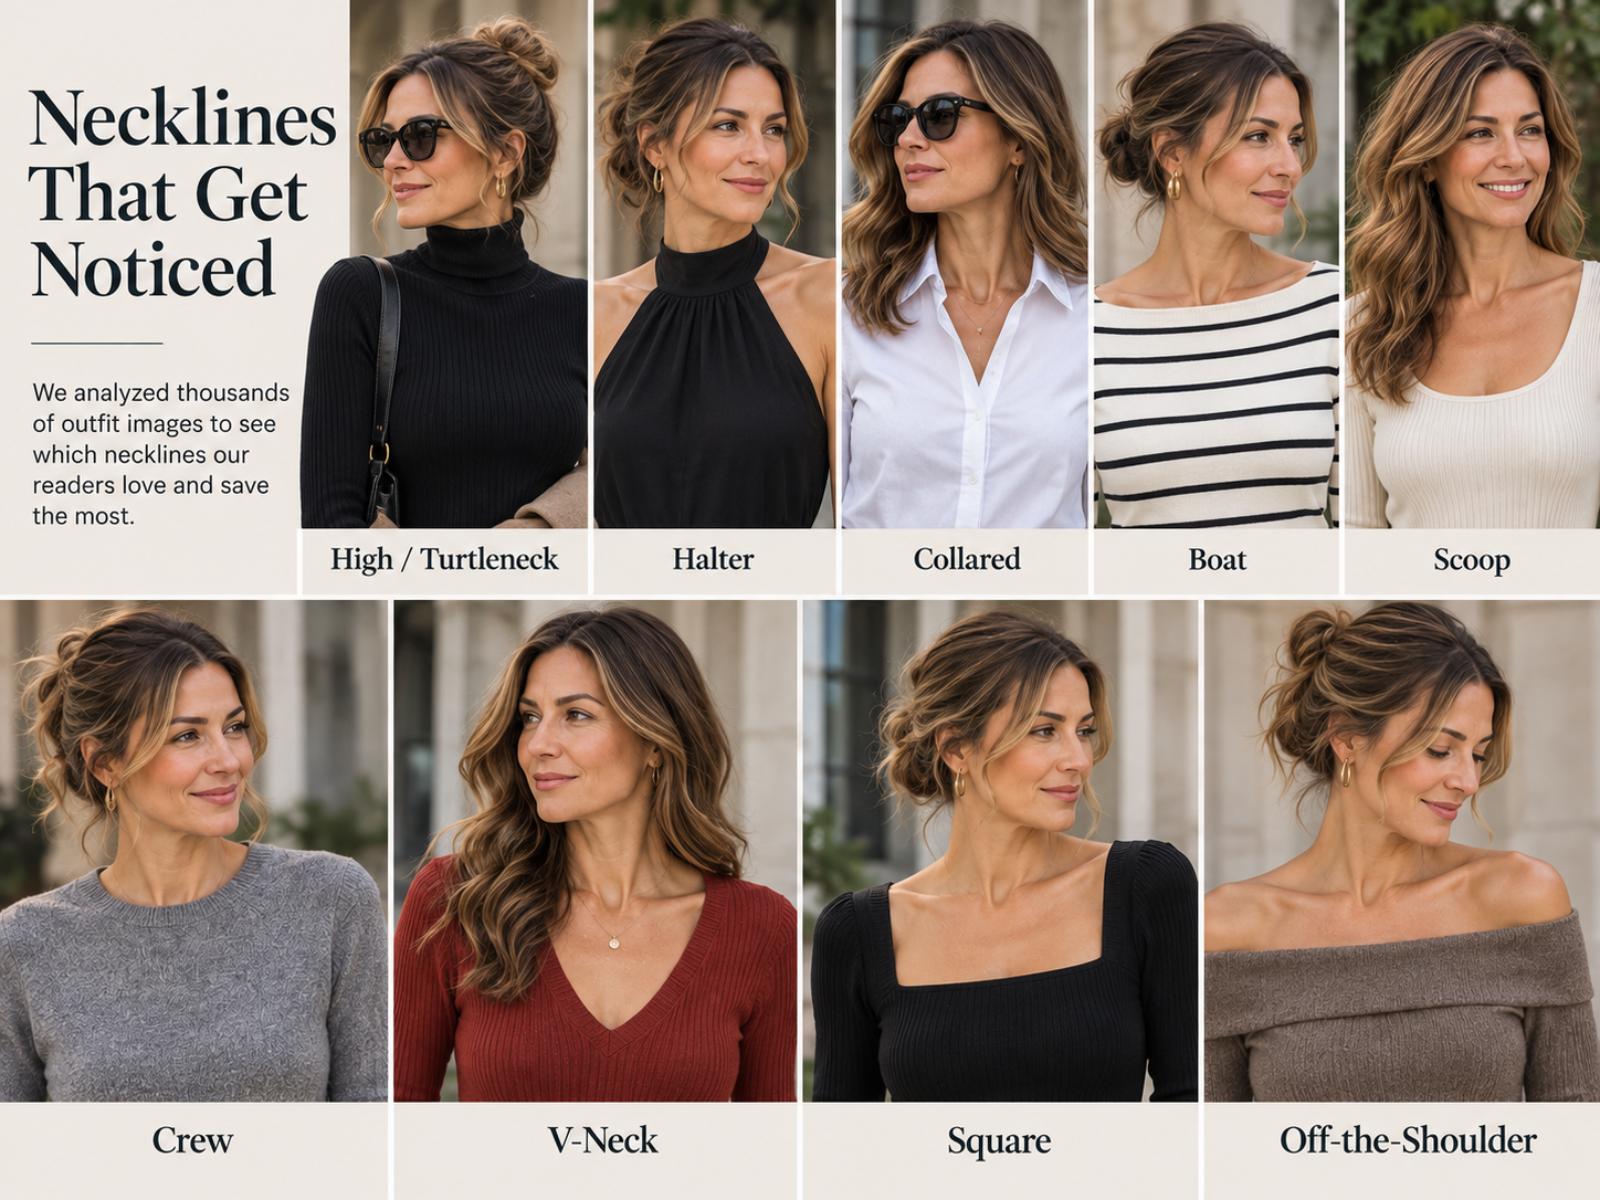
If you asked me to guess which neckline women respond to most strongly, I wouldn’t have picked the turtleneck.
A V-neck seems like the obvious candidate. It’s one of those pieces of advice women hear forever: V-necks elongate the neck, draw the eye vertically, and are supposedly one of the safest flattering choices.
Maybe a scoop neck. Maybe a classic crew.
But when we looked at how ThreadCurve readers actually interacted with thousands of outfit images, none of those came out on top.
High necks and turtlenecks did. And they didn’t just win—they separated from every other neckline we measured.
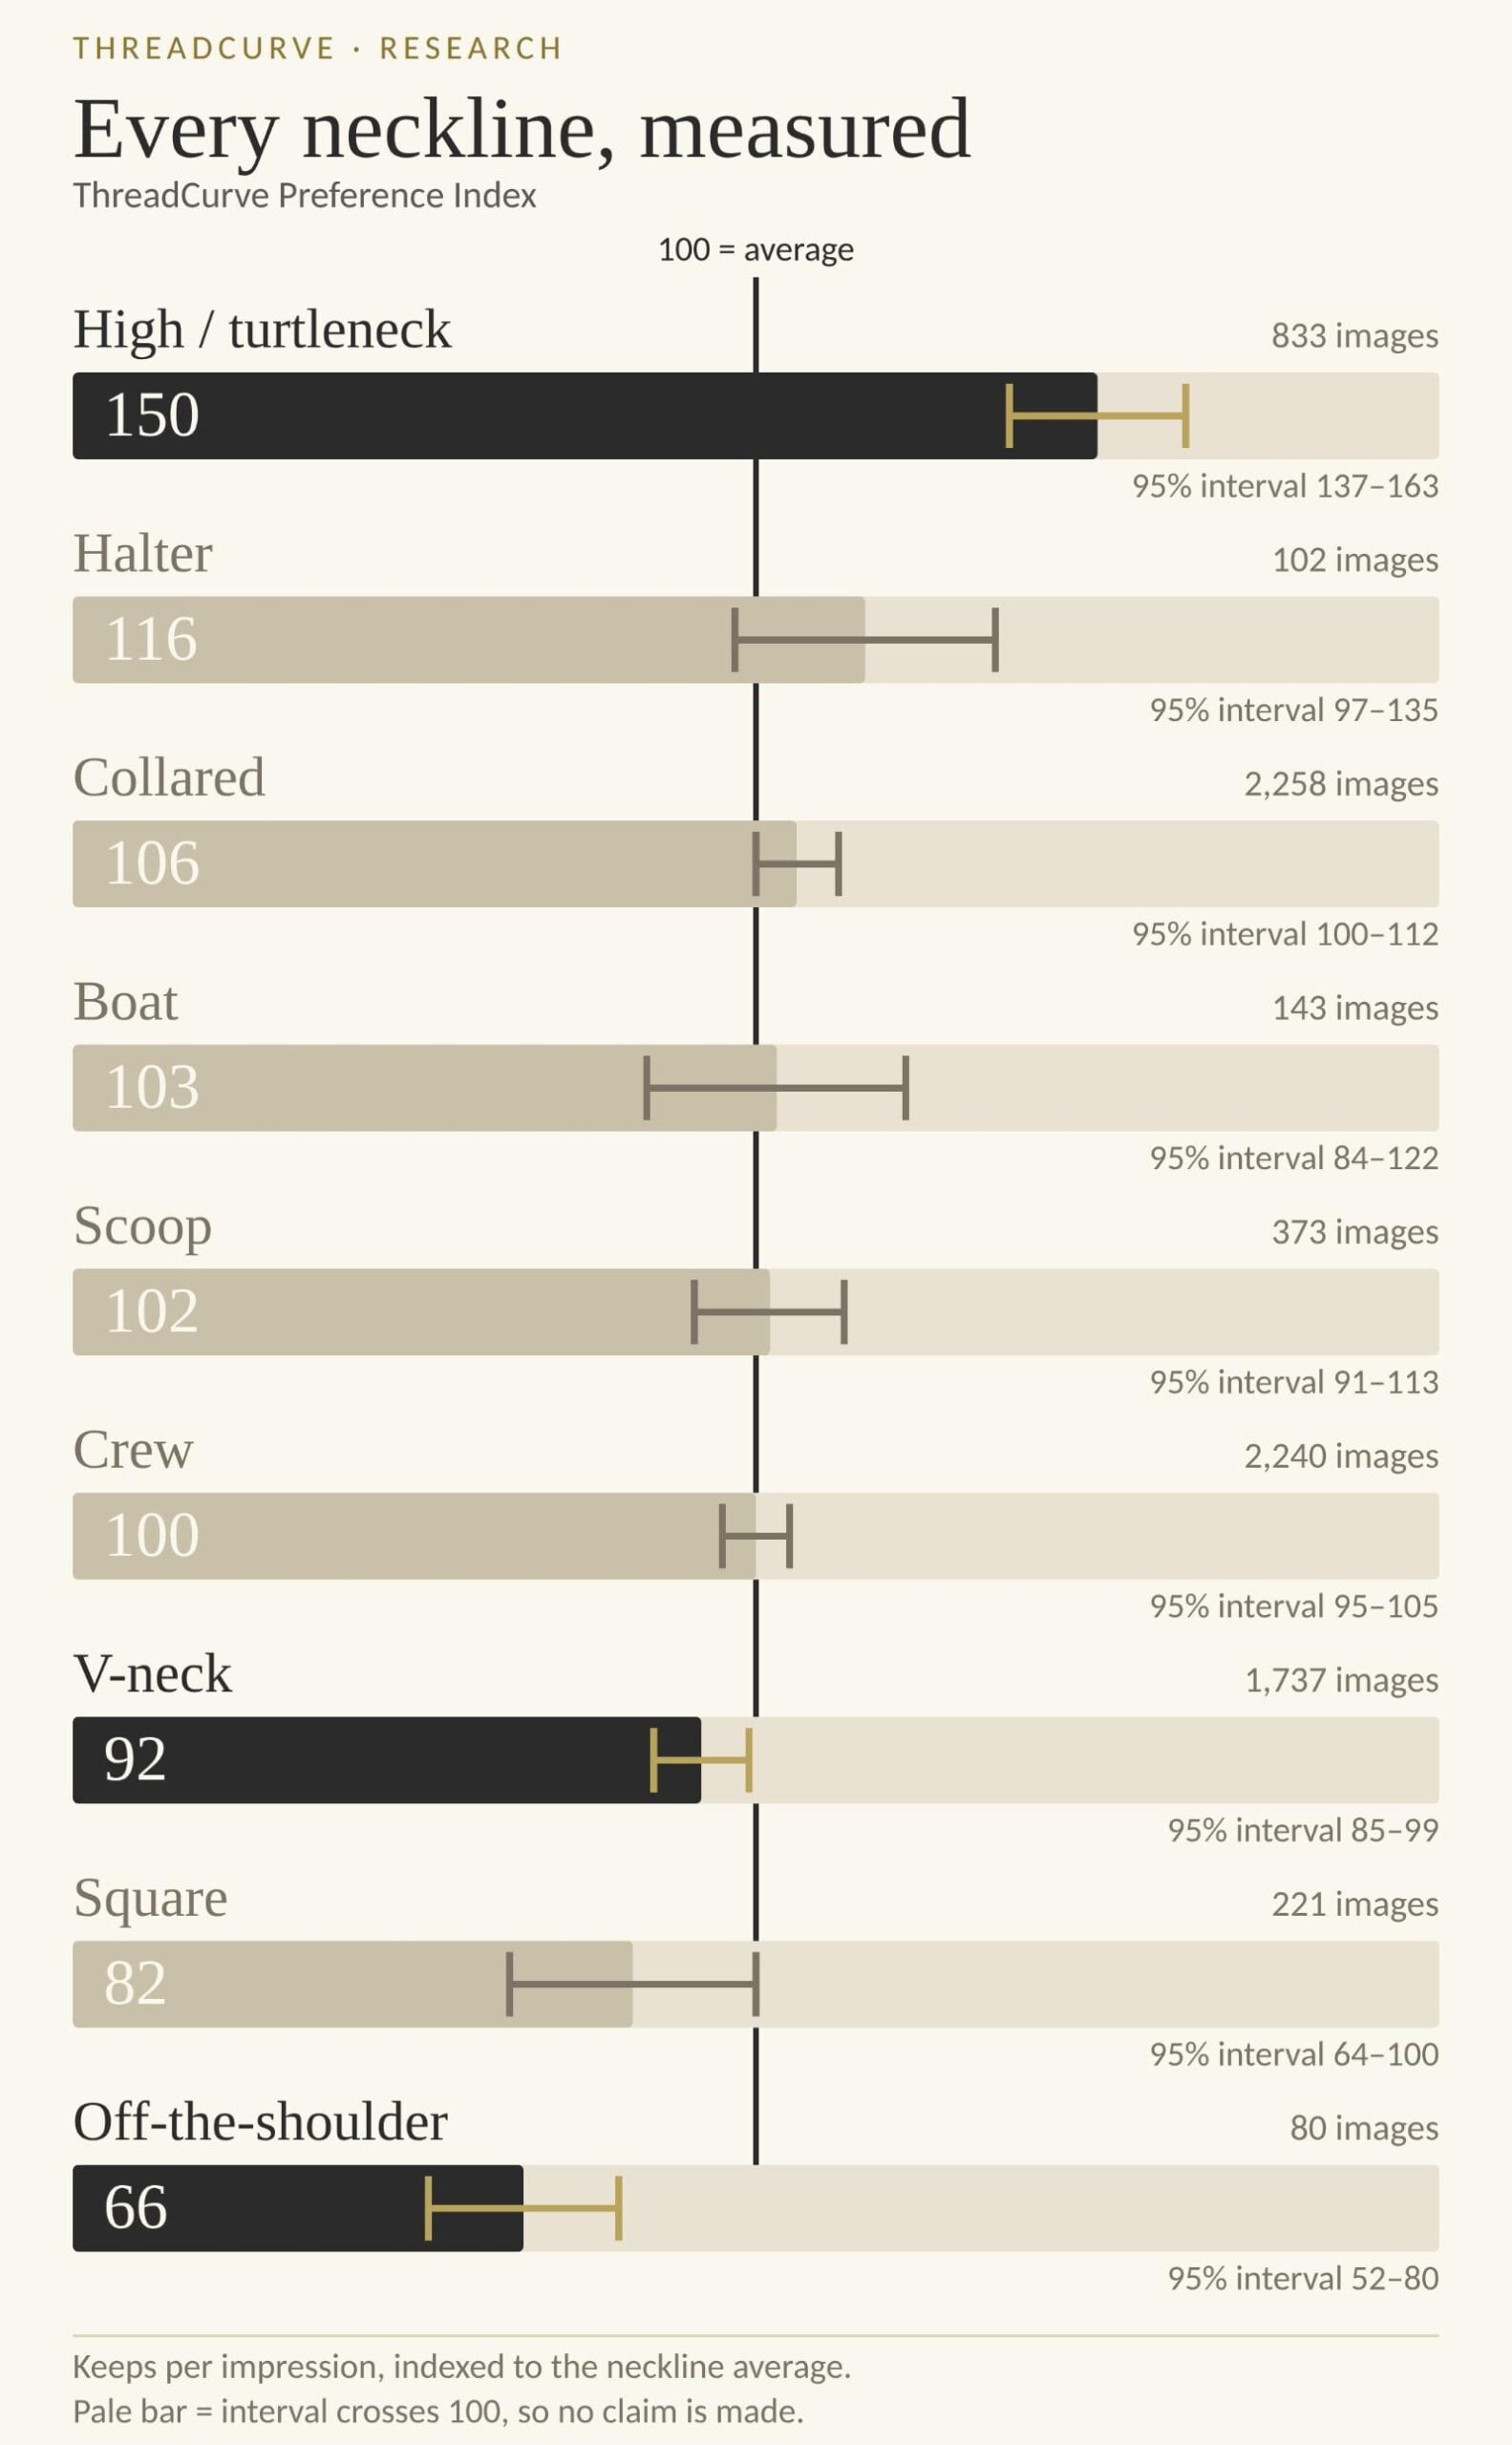
High Necks Are Performing 50% Above the Neckline Average
We identified 833 outfit images featuring high necks or turtlenecks across 195 articles.
Readers gave those images 406 loves and 145 saves, for a total of 551 keeps.
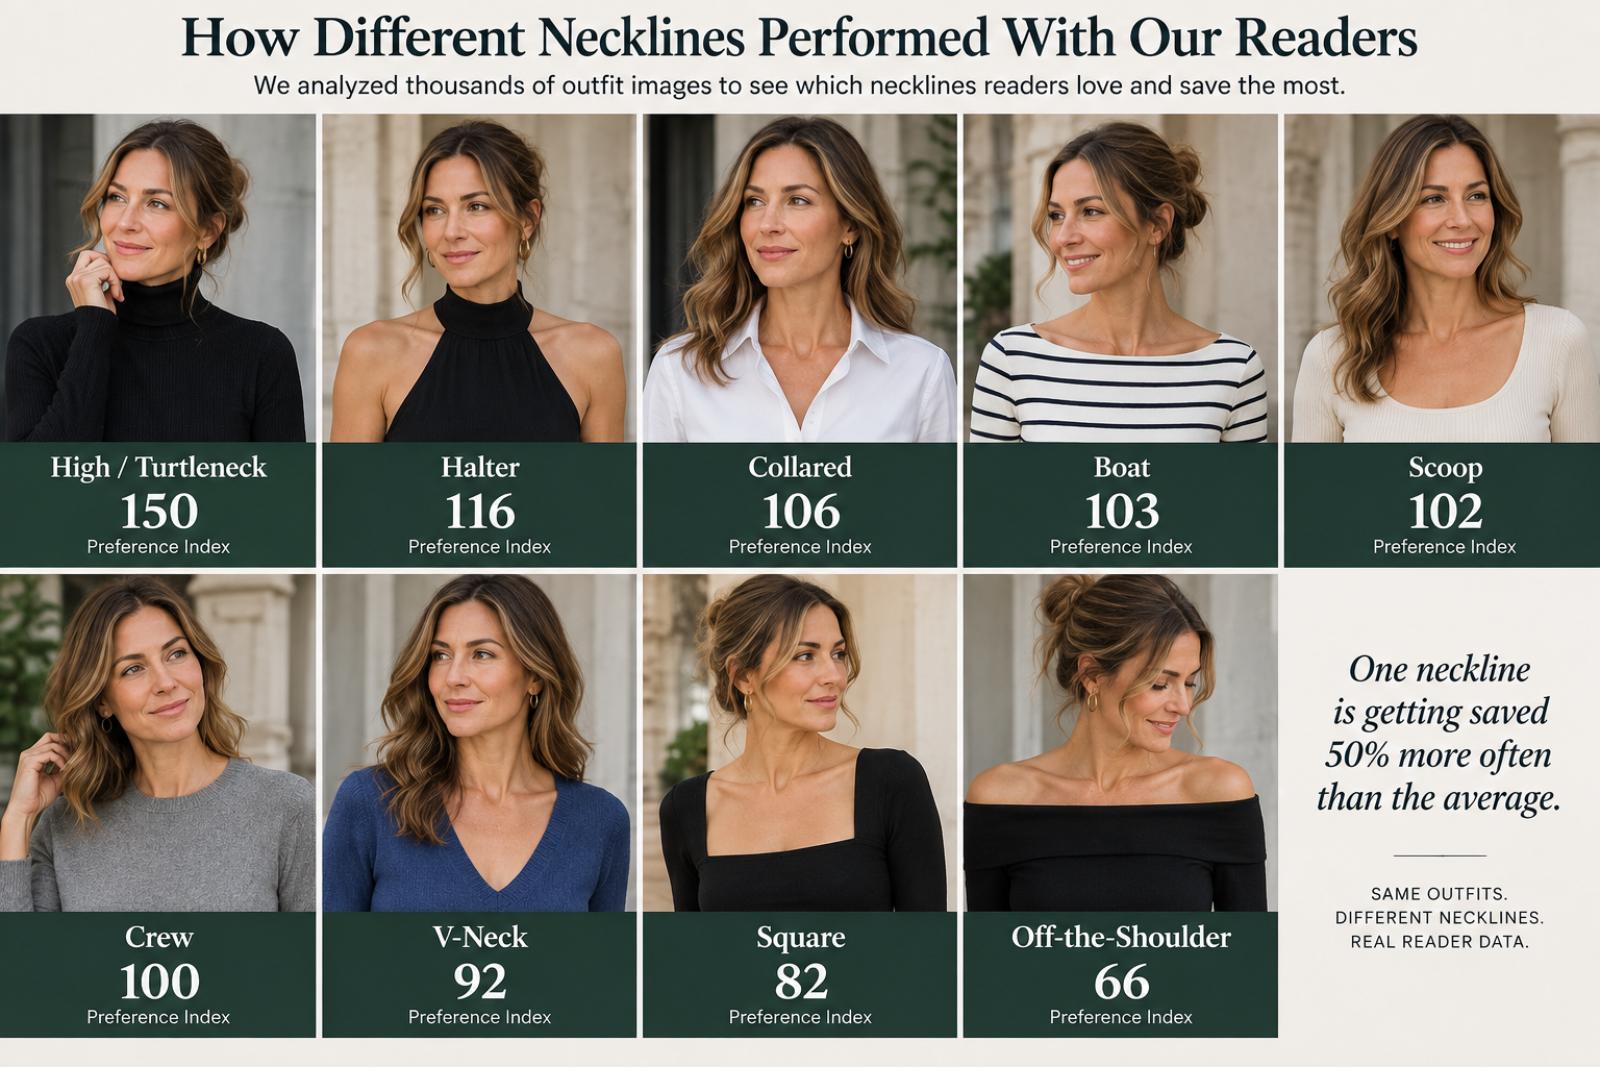
High and turtleneck outfits scored a 150 preference index, with a 95% confidence interval running from 137 to 163.
An index of 100 represents the average keep rate for necklines in our dataset. So high necks aren’t merely popular—they’re kept at a rate 50% higher than the neckline average, and even the bottom of that interval sits well clear of it.
| Neckline | Images | Keeps | Index | 95% CI | Verdict |
|---|---|---|---|---|---|
| High / turtleneck | 833 | 551 | 150 | 137–163 | Above average |
| Halter | 102 | 143 | 116 | 97–135 | Not established |
| Collared | 2,258 | 1,253 | 106 | 100–112 | Borderline |
| Boat | 143 | 117 | 103 | 84–122 | Not established |
| Scoop | 373 | 330 | 102 | 91–113 | Not established |
| Crew | 2,240 | 1,401 | 100 | 95–105 | Exactly average |
| V-neck | 1,737 | 706 | 92 | 85–99 | Below average |
| Square | 221 | 80 | 82 | 64–100 | Borderline |
| Off-the-shoulder | 80 | 91 | 66 | 52–80 | Below average |
Read the verdict column before the index column. It’s the more useful one.
Only four of these nine necklines produce a result our data can actually stand behind: high/turtleneck above average, V-neck and off-the-shoulder below it, and crew sitting exactly on it. Everything else has an interval that straddles 100, which means we can’t say whether it performs above or below average at all.
Half the Ladder Is Statistically Indistinguishable From Average
This is the part most neckline articles would skip.
Halter at 116, boat at 103, scoop at 102 — those look like a ranking. They aren’t. All three intervals cross 100, and they all overlap each other. Ordering them is reading noise.
Collared at 106 runs from 100 to 112, which puts it barely on the right side of the line on a very large sample. Call it a whisker above average and don’t build anything on it.
So the real shape of this data isn’t a nine-step ladder. It’s one clear winner, two clear losers, and a large indistinguishable middle.
The Classic Crew Neck Is Exactly Average
Few necklines are more ubiquitous. We found 2,240 images featuring one, and readers kept 1,401 of them.
That’s plenty of engagement. But once we account for how often those images were shown, the crew neck lands at an index of exactly 100, with an interval of 95 to 105.
It is, precisely, the definition of average here—and with that sample size, we know it with more confidence than almost anything else in the table.
High necks and turtlenecks scored 150.
The V-Neck Result Is the Surprising One
V-necks might be the most interesting loser.
We identified 1,737 V-neck images across 269 articles, generating 706 keeps and an index of 92, running 85 to 99.
That whole range sits below 100, so this isn’t a borderline call. On a sample this large, V-necks underperformed the neckline average.
Which runs against a lot of conventional styling advice.
V-necks are routinely presented as the flattering, elongating choice. Turtlenecks come with warnings about short necks, large busts, round faces and adding bulk through the upper body.
Our readers don’t appear particularly concerned.
The Result Nobody Talks About: Off-the-Shoulder
The strongest negative signal in the entire set isn’t the V-neck.
Off-the-shoulder necklines scored 66, with an interval running from 52 to 80. That’s 34% below the neckline average, and the interval doesn’t come close to touching 100.
The sample is small—80 images, 91 keeps—which is why the interval is wide. But wide as it is, it’s entirely below average. Even the optimistic end of the range is a bad number.
And that’s where this stops being a story about turtlenecks and starts being a story about something else.
Coverage Tracks Preference
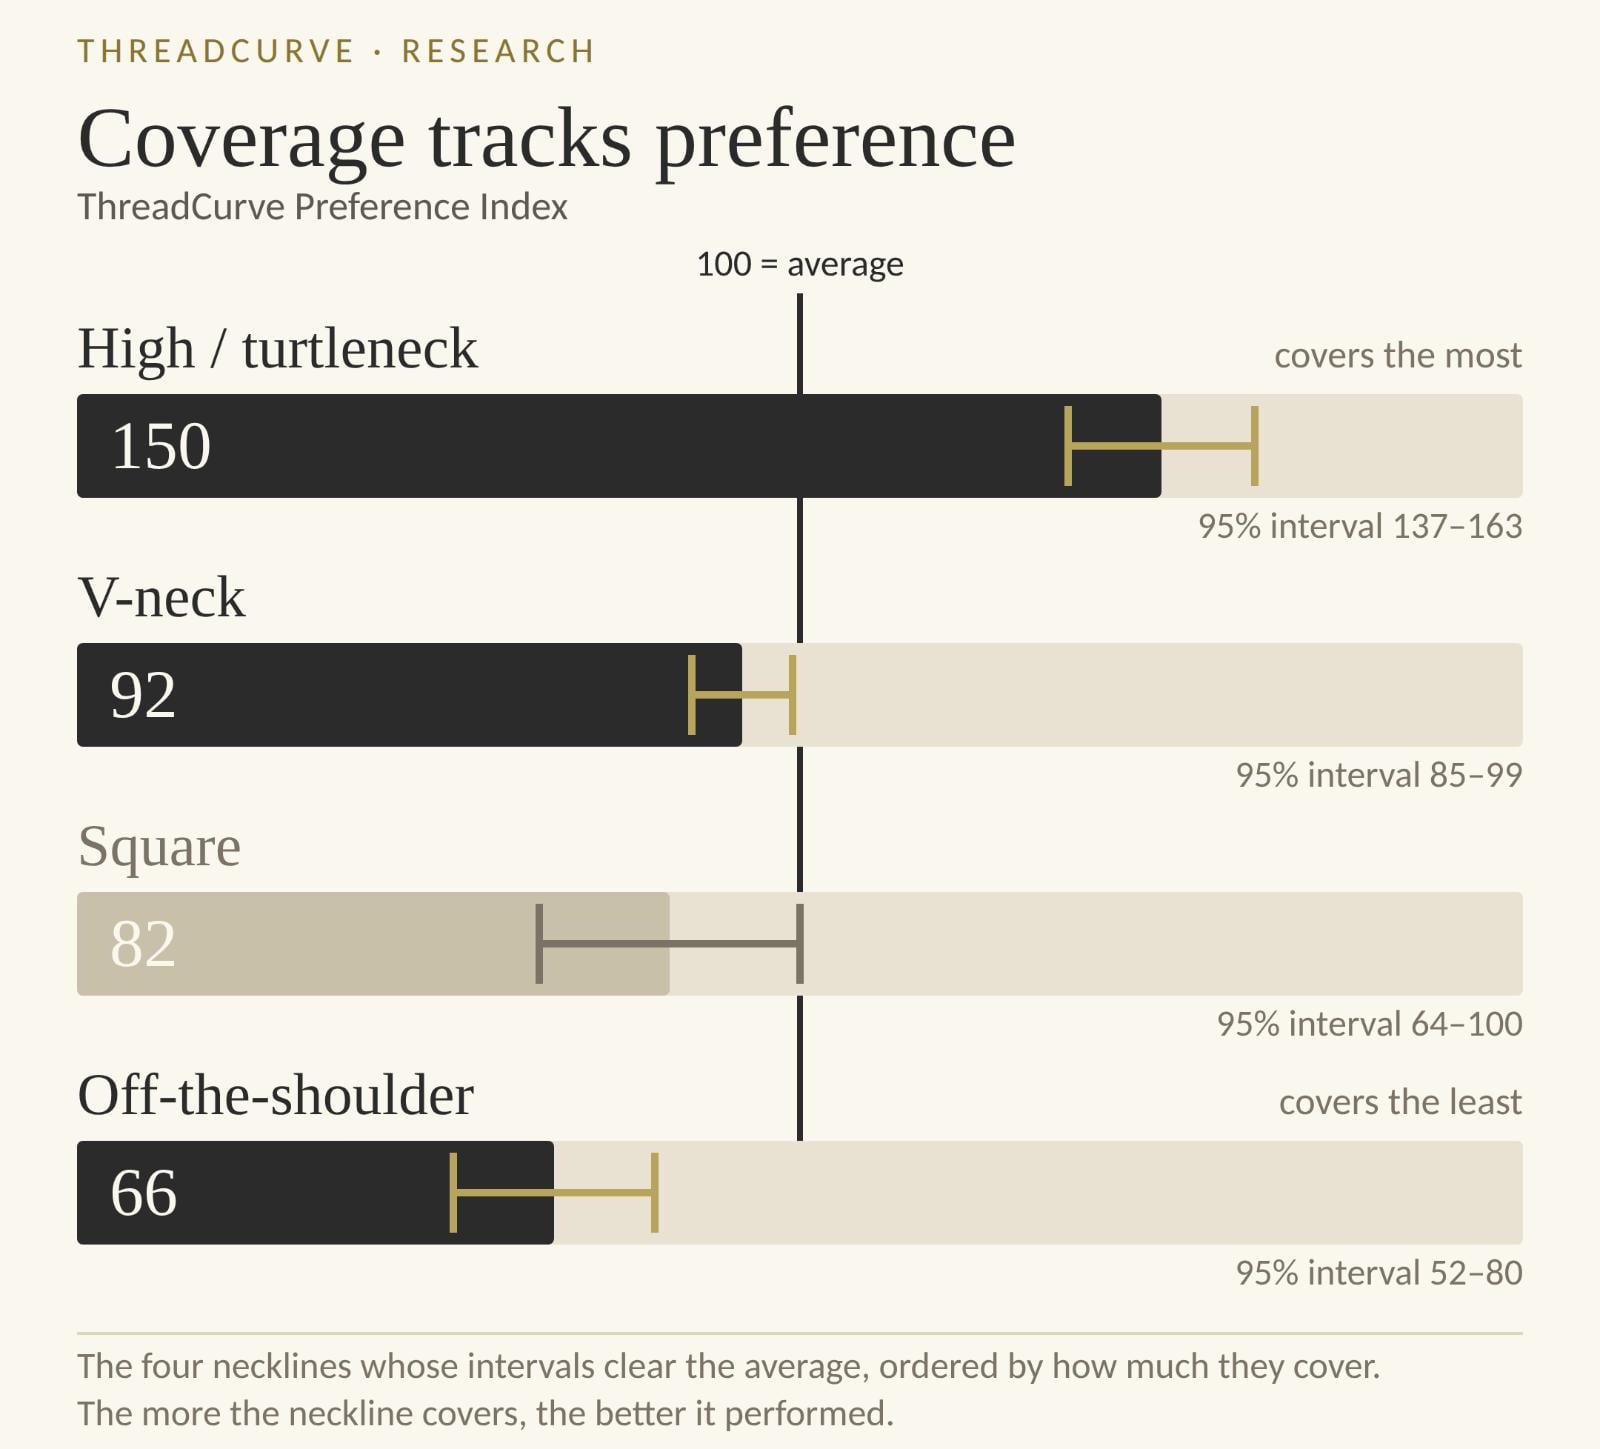
Take only the necklines where our data supports a verdict, and order them by how much skin they expose rather than by index.
High neck, covering the most: 150.
V-neck: 92.
Square: 82.
Off-the-shoulder, covering the least: 66.
That’s monotonic. The more the neckline covers, the better it performed with our readers.
I want to be careful here, because a clean pattern across four points is exactly the kind of thing that can be a coincidence. Square’s interval is borderline, and the middle of the ladder is too noisy to test the pattern properly.
But it’s a striking enough shape to be worth stating and worth watching.
Why Might Turtlenecks Be Working So Well?
The data tells us what readers responded to. Not why.
But there’s a styling explanation worth considering.
A turtleneck does something most necklines don’t: it creates a strong frame for the entire outfit. Instead of the neckline being a small detail within a top, it becomes part of the silhouette.
It also works exceptionally well with layering. Put a turtleneck under a blazer, coat, cardigan, vest or jacket and you get multiple vertical and horizontal lines, more texture, more visual depth.
That matters, because another pattern in our ThreadCurve data points the same direction: outfits with three or more visible layers indexed at 180, against 88 for single-layer outfits.
So the turtleneck result may not exist in isolation. It could be part of a larger preference for outfits that look styled rather than merely dressed.
Consider two basic outfits. Jeans and a crew-neck sweater. Jeans and a fitted turtleneck under a blazer.
Neither requires unusual clothing. But the second has more structure. The neckline frames the face, the blazer adds a layer, the turtleneck provides a clean uninterrupted base underneath.
It looks deliberate without looking complicated.
A Second Measure Points the Same Way
The index isn’t the only signal here.
High and turtleneck images also won 57.2% of their direct head-to-head comparisons across 304 votes. That’s a different measurement method entirely—readers picking between two images rather than reacting to one—and it lands above 50% by a margin that holds up.
Two independent measures agreeing is worth more than either one alone.
Maybe “Flattering” Isn’t What Readers Are Looking For
That’s what I find most interesting about this.
Fashion advice—particularly advice aimed at women over 40 or 50—can become obsessed with flattering rules. Lengthen this. Minimise that. Expose this much neck. Avoid anything that widens that area.
But people looking at outfits may be responding to something else entirely.
They may simply want the outfit that looks better put together.
This doesn’t tell a retailer that turtlenecks will outsell V-necks. We’re not measuring sales. Nobody in this data bought anything.
What it does is tell you which assumptions are worth questioning. “V-necks are the flattering safe choice” is an assumption, held widely enough that it shapes how a lot of clothing gets designed and photographed. In front of an image, with our readers, it’s the assumption that doesn’t hold.
The supposedly safe V-neck isn’t winning. The trendy square neckline isn’t winning. The universally basic crew neck isn’t winning.
The turtleneck is.
About the Data
ThreadCurve measures reader interactions with individual fashion images. The Preference Index compares keeps—love and save actions relative to estimated image exposure—against the average for the relevant group. An index of 100 represents average performance.
This is observational image-preference data, not sales or purchase-intent data. Impressions are sampled and scaled estimates, and results are most useful for comparisons within the dataset. Where an interval crosses 100, no difference from average is claimed. Where two intervals overlap, no difference between those values is claimed.
The current ThreadCurve export contains 15,675 tagged images across 541 articles.